Market research contributes to many of the tactical decisions, but the wealth of new data sources and forms, combined with various analytics, means MR can meaningfully contribute to more strategic decisions regarding the products and services being offered. What markets do we enter? What markets do we exit? What products and services do we add, refine or emphasise to meet the needs and wants of individuals, households, and firms – and to grow the business profitability?
One of the most useful structures for framing product portfolio strategy discussion is market structure or competitive landscape. What products or services compete with each other, to what degree do they compete, and why? When populated with historical sales data, a number of important questions can be answered.
- What product/service segments are growing faster or slower?
- Is the firm’s portfolio aligned to growth?
- How do the firms’ growth prospects compare to competitor firms?
- Where are the greatest new product/service opportunities, and what size of business can reasonably be expected?
- Are there flanker and extension opportunities, and for which brands in which product/service segments?
- If new products are not a viable way to enter an attractive product/service segment, what acquisition targets are attractive?
Approaches
Identifying product/service segments usually involves some direct or indirect measurement of the degree to which items are substitutable or similar. Econometric approaches usually involve price elasticities and/or brand switching. Survey approaches usually involve simulated trade-offs or measures of perceived similarity. A partial list of approaches:
- Analysis of price elasticities based on continuous syndicated sales data
- Analysis of brand switching based on longitudinal purchase patterns
- Analysis of claimed past purchase (survey), often based on correlation or covariance
- Sorting into dynamic groups (survey)
- Analysis of brand perceptions, usually based on survey data
Each approach has its own strengths and weaknesses, and recommendation is based on context and specific objectives.
A case study
The client is a global food and beverage fmcg predominantly focused on breakfast and morning eating occasions. Their syndicated sales databases were organised on the basis of a market structure/competitive landscape that had been created many years earlier. Consumer tastes and behaviors had evolved and it was times to update their understanding. A simplified example might look like:
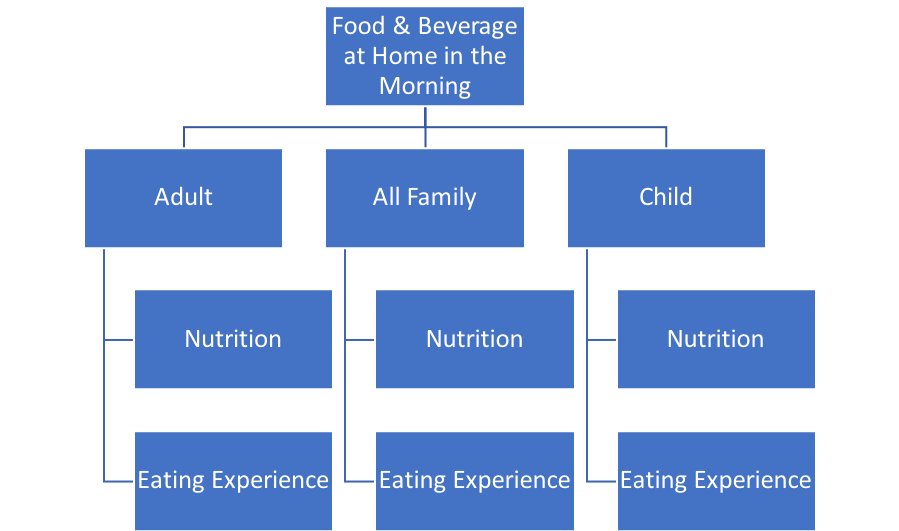
The most critical project objectives were to:
- Identify the relevant competitive structure/product segments in several of their most important markets, which would then be used to realign the syndicated sales data base
- Delineate in detail “how” and “why” brands cluster into their various product segments, which would ease transition from strategy to tactics
Challenge #1; a framework that serves both strategy and tactics
Strategies often fail in implementation because they are too abstract. In discussions with client, the most attractive framework for organising detail was brand architecture, and the critical elements were:
- Target
- Occasions
- Functional benefits
- Emotional benefits
- Key attributes
If brand profiles were available for all (or nearly all) brands in the respective markets, the key objectives could theoretically be achieved;
- Brands could be clustered based on their profiles (in roughly the same way that consumers are clustered in consumer segmentations)
- “How” and “Why” brands are similar or different would be clear from both the analysis and aggregated brand profile comparisons
Additionally, a well articulated market structure, combined with sales data and the appropriate analytic tools, could answer important foundational questions:
- What elements of brand architecture are critical to growing existing brands or to creating new brands?
- Where do we focus; target, functional or emotional benefits, occasions?
Challenge #2; data paucity, especially in developing markets
In the age of big data, data paucity in certain markets might be a surprise. In developed markets syndicated sales data coverage might be close to 100%, but in some relevant developing markets it is less than 50%. Household purchase panel data is typically more limited. Surveys with large sample sizes could be used to augment, but even here there are issues. The relatively low penetration of relevant product categories and brands negatively impacts what can be achieved with either household purchase panel data or survey data. In some markets the majority of brands have annual penetration of 1% or less.
Merging multiple streams of data
The solution was found in a qualitative form of data combined formally and holistically with the aforementioned traditional quantitative forms of data; a synthesis of syndicated sales, household purchasing behavior, quantitative survey and qualitative semiotics.
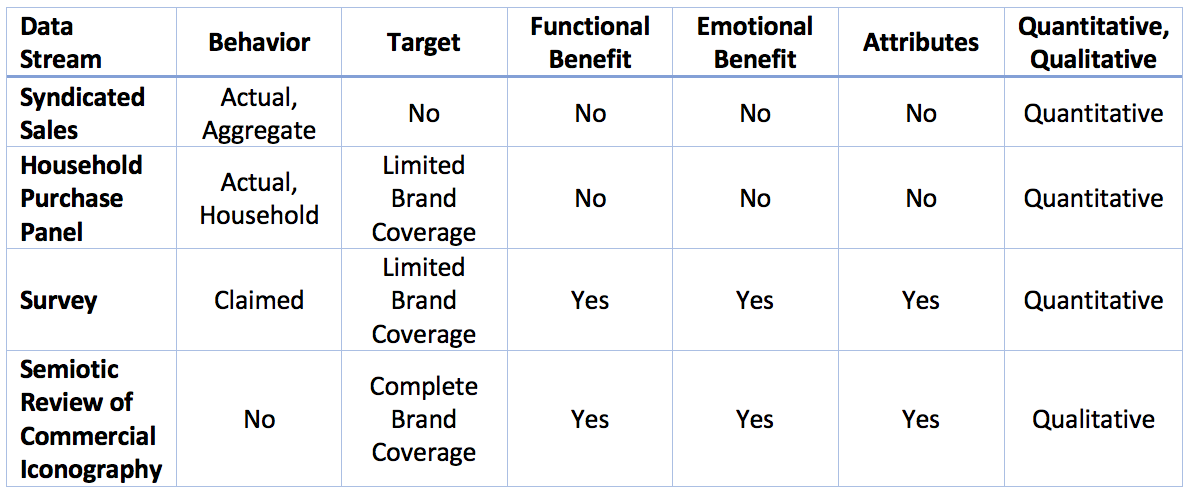
The table below describes the different data streams, and what each could contribute to informing the brand profiles.
Semiotics
In this case a semiotician interpreted readily available commercial iconography – packaging, advertising, websites for all (or nearly all) brands in all markets to infer the various elements of the brand architecture; who the target is, what the functional and emotional benefits are, what the occasion is, etc. Semiotic inference was especially useful for identifying the emotional benefits.
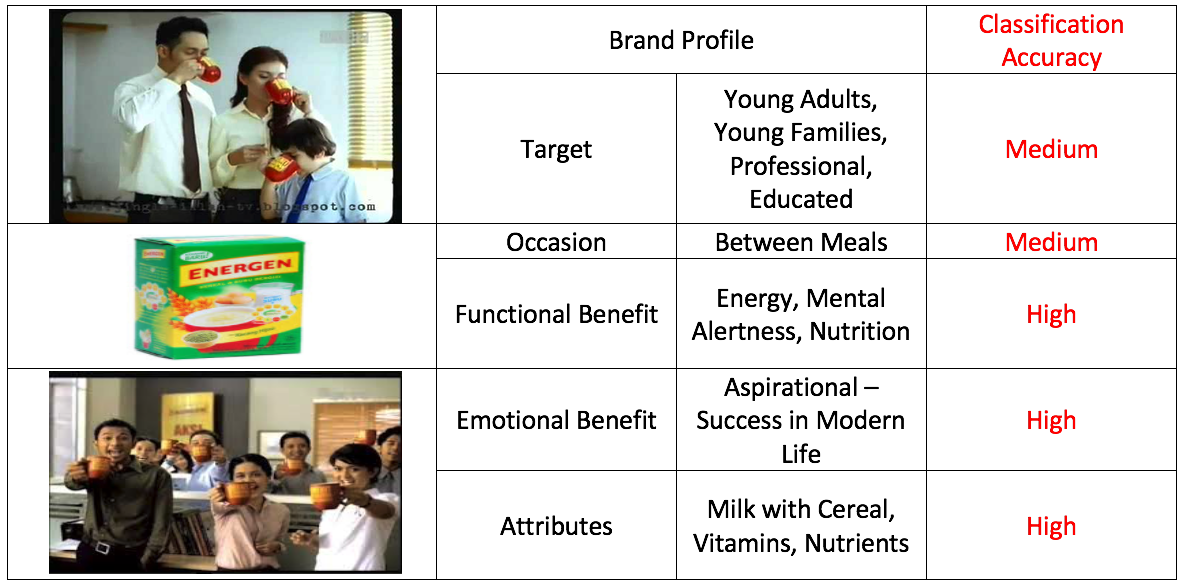
The chart below displays how this works and how it is validated. The brand is Energen – a breakfast cereal drink that originated in Indonesia. You can see the inferred target, occasion, and functional and emotional benefits. Since this is a fairly ubiquitous brand, there is adequate quantitative data that can be used to validate the semiotic inferences. Here, the semiotic inference for target and occasion was not wrong, but it was too narrow; the brand was consumed by a broader demographic across a wider set of occasions. Across the various markets, this kind of validation could be done for 10% to 70% of the brands, on various brand profile elements. Indeed, predictive models could be created for various visual and text icons.
Proof of concept
Given the forms of data and how they were merged, proof of concept/validation was important to build faith in the final product. Brand profiles built semiotically were validated against brand profile elements from quantitative data where those existed. Some markets had market structures built recently from household purchase panel data (considered by client to be the gold standard). Fusion based market structures were compared to these.
While the deliverable met objectives, attention areas were:
- one important market failed to embrace final conclusions because of the inclusion of qualitative data despite efforts to build credibility
- it was difficult in certain markets to find semioticians
- the semiotic coding was time consuming, but we hope that as AI develops, there will be better ways to “code” visual iconography
Fusion approaches promise to provide flexible, holistic, and end-to-end solutions. The key in this case study was a framework for merging multiple streams of data. While the unstructured data flowed from semiotics, we think there is opportunity for other forms of unstructured data such as social media, biometric data, geo-location, and passive metering.