For those vaccinated, it may already feel like the pandemic is over. But, with a global third wave, and the US currently at an annualized run rate of over 200,000 deaths from COVID-19, it is too soon to declare victory.
In November, with a line of sight to a start to vaccinations globally, I published the Briggs-3 model in Research World (LINK: https://archive.researchworld.com/covid-19-forecast-update/) and projected the end to the pandemic in Q3 in the US and Europe. Specifically, I was referring to the end of the pandemic as the point when the deaths per million from COVID-19 dropped to levels similar to a bad year of the flu. In the US, this equates to about 61,000 deaths per year, or about 4 deaths per week per million people. Today, the US is around 13 or more deaths per week per million and Europe is somewhere above 20 – far worse than a bad year of the flu.
The total death toll official counts are difficult to know with certainty – which is why I write “around 13 or more” in the US and “somewhere above 20” in Europe. The official counts show Europe at about the same as the US in terms of deaths, but with countries in Europe like Russia, Romania, Poland Serbia, and Bulgaria suspected of significantly under counting by 200% or more, Europe is worse off than the US.
In total, as of May 23rd, IHME estimated Europe under counted by 240% and the US under counted by 57% (LINK: http://www.healthdata.org/special-analysis/estimation-excess-mortality-due-covid-19-and-scalars-reported-covid-19-deaths). On the other hand, both the CDC (https://www.cdc.gov/mmwr/volumes/70/wr/mm7014e1.htm) and the Economist (https://www.economist.com/graphic-detail/coronavirus-excess-deaths-tracker) estimate the US under counted by about 7%. (The WHO European region wasn’t summarized in the Economist charts, but based on the comparison of a few countries such as Russia and England/Britain, The Economist estimate of under count would be about half of IHME’s estimate.) Suffice it to say, whatever the official count of deaths is, the actual is likely worse. These figures remind us the pandemic is not over.
Aside: To see each country’s reported deaths versus The Economists estimates, check out this excellent visual, and click on “Absolute” in the graphs: https://www.economist.com/graphic-detail/coronavirus-excess-deaths-tracker, or check of IHME, which estimates the WHO European Region, and each individual country: https://covid19.healthdata.org/european-region.
Yet, the Pandemic feels over for those vaccinated. Life is coming back to normal with restaurants expanding capacity. Mask mandates no longer apply in most of the US. Social gatherings are picking up again. Are we on the path to the end of the pandemic? Or, by changing our behavior to pre-pandemic status, did we just snatch defeat from the jaws of victory?
Breakthrough cases
Today, the most important data to watch is related to breakthrough cases. If it turns out that a fast spreading variant can substantially evade vaccination immunity, the pandemic will not end in the US and Europe in Q3.
I think of the virus like a group of babies trying to open a combination lock. It is a brute force spinning of the numbers to see if something opens the lock. If one can’t open it, the lock is handed over to another that spins the dials. While the odds are low that the lock will ever open, the more attempts, the better the odds are that the lock will open.
What are the opportunities to crack the lock? There are two components: 1) The total number of active infections in a community, 2) total number of interactions in a context favorable to spreading the virus.
The total number of active infections in the US can be roughly approximated by taking the number of confirmed cases in the past 7 days and multiplying by 10.
Why 10? People with COVID are contagious for up to 16 days, and my research estimated the US confirmed cases have undercounted actual infections by about four and a half times. (See my blog 6 February (LINK: https://docs.google.com/document/d/1whTzIuA7LSJQEhnUHPTb3je2u7aQhkyxXI8isTLYxPw/edit?usp=sharing for details on the confirmed cases to infections ratio, as well as a link to another study that found a similar ratio).
A month ago, I estimated the active infections at about 3.5 million in the US. Today, it is about 1.2 million. It is coming down fast. However, 1.2 million is still a lot of opportunities to crack the lock and to enable a variant that can evade vaccine protections.
The UK is waiting longer to relax mask mandates even though they are ahead of the US on first dose vaccinations and have fewer active infections. Personally, I would have liked to see the US get active infections below 500,000 before relaxing mask mandates.
What concerns me about the US path is that I’m seeing a reversal in the declining 21 day lagged Case Fatality Rate (CFR) trend. Among the people that die of COVID, the average interval from confirmed case to death is 21 days. The 21-day lagged CFR calculates the percent of people with a confirmed COVID-19 diagnosis that die 21 days later. The rate in the US has averaged 1.7% pre-vaccinations. Based on vaccine efficacy rates, and differential vaccinations by age cohort, I calculated that the figure should drop to 0.9% as SARS-CoV-2 became less deadly. Indeed, the figure trended down to 1.0% in early May. But, as mask mandates lifted, and social distancing relaxed, the 21-day lagged CFR has climbed 30% and now sits at 1.3%. This is an improvement from pre-vaccination levels, thanks to a high vaccination rate among 65+, but still not a good trend. I am expecting the CFR to slowly come down again to 1% by the end of August. As a result of lifting social distancing and mask mandates, my model now forecasts an incremental six to ten thousand deaths from COVID-19 this year.
I have certainly heard the argument that lifting the mandates is appropriate. The logic goes that those at risk of dying of COVID-19 now are people that specifically chose not to get the vaccine as of yet. Considering the official count will pass 600,000 deaths from COVID this month in the US, and the potential incremental deaths from lifting the mandates early is an incremental 1% to 2% increase in total deaths almost exclusively among those who choose not to be vaccinated, the view is it is an appropriate trade-off. Reasonable people may come to different conclusions as to whether certain states and the CDC acted prematurely or not in relaxing mask mandates.
Politicization of vaccinations in the US
In the past month, my model shows that who you voted for in the last presidential election has become 10x more important in predicting whether someone will or will not be vaccinated. The increased politicization evidenced in the US model is a concern. In September of 2020, I updated the Briggs-1 Model to Briggs-2, raising the total death projection by 50,000 due to the politicization of mask mandates. That change turned out to be right, as total deaths ended the year almost exactly as forecast.
In terms of vaccinations, states and counties that voted for Trump in the 2020 election were more likely to be vaccinated in the months of December, January and February. But, by March the trend began to reverse. Now, these states and counties are significantly less likely to be vaccinated, and the rate of growth in vaccinations within these conservative counties is substantially less. For more details and data, see my May State of Vaccine Hesitancy Analysis in America (LINK: https://thearf.org/post-pandemic-business-recovery-research/ )
If we see a variant emerge that evades vaccination, will there be a political backlash against those that chose not to be vaccinated and therefore imperiled the rest of the people’s lives and livelihoods? How will the population respond to a re-imposition of pandemic mandates? How fast can boosters be developed, distributed and administered to deal with such a variant? How deadly and economically disruptive would such a breakthrough scenario be?
Fortunately, the odds of a variant that evades vaccination that spreads broadly are low. It is something I’m monitoring and I encourage you to monitor as well (Tweet me, @rexbriggs, if you find something that catches your eye).
Countries, states, local health agencies, CDC and WHO need to step up their game on tracking and reporting breakthrough case data. This means linking every case, hospitalization and death to vaccination status, performing genetic sequencing in each breakthrough case, and applying sewage surveillance to measure relevant sequences.
Based on analysis of the State of Washington’s reporting of breakthrough cases, it appears there are significant holes in matching confirmed cases to vaccination records. Initially, Washington state missed half of breakthrough cases (LINK: https://www.doh.wa.gov/Newsroom/Articles/ID/2740/Update-on-vaccine-breakthrough-cases-in-Washington-state). It was only through an extra search at the county level that they had a more complete count of breakthrough cases. If Washington is indicative, half the breakthrough cases may be missed in the US count.
It is also important for governments and the media to do the math correctly. Too often you will see breakthrough cases divided by total population vaccinated. A more meaningful calculation is to take a date range for the breakthrough cases, calculate the vaccinated population at the mid-point and use that as the denominator. Then, compare the percent of the total cases within the total population to the percent of cases among those vaccinated. My analysis of the Washington state data for April found 94% vaccine efficacy, which is very good.
In terms of genetic sequencing, the UK is doing the most in terms of sequencing. The rest of the world can certainly do more. In terms of passive surveillance, such as sewage measurement (LINK: https://archive.researchworld.com/break-point-covid-19/), and randomized testing, a lot more should be done to monitor infections and variants.
COVID deaths forecast vs actuals
May ended at 13 deaths per million per week in the US (see chart). This is a bit above the original forecast from November, 2020 in part because Oklahoma and Maryland played catch up on death reporting a few days ago. If we adjusted for this anomaly, the count would be around 9 deaths per million per week.
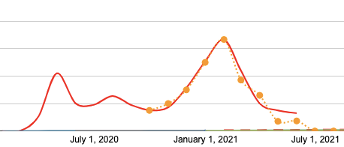
Note: Model automatically updates, and now forecasts higher deaths in June and July than shown in this chart.
The total cumulative number of COVID-19 deaths reported in the US is 594,201 as of May 31. This is above the three-month forecast of 582,709 made on March 1, 2020 and a bit under the short-term one month forecast made on May 1 of 595,687. In other words, we are roughly where the model forecast would be at this time.
Looking forward, the original Briggs-3 forecast expected a vaccination and natural immunity due to infections would effectively end the Pandemic in the US and Europe in Q3. The vaccination trend is fairly close to the forecast for the US. Europe is about 45 days behind the US in terms of vaccinations.
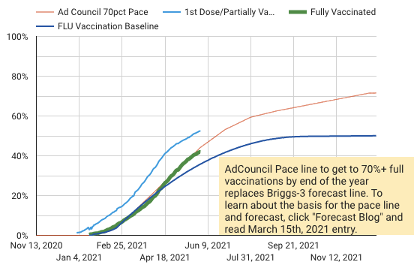
Chart Explanation: The Orange line is the pace line I modeled that would get the US to 70% of the total population fully vaccinated. It is an ambitious goal, as the original forecast predicted 63% fully vaccinated by the end of the year. The blue line is the vaccination rate baseline, based on studying the past decade of flu vaccination rates, and observing the higher rates correlated with higher death rates. The expected level for COVID-19 is about 20% higher than the highest flu vaccination rates. The orange line assumes a level of effective PSAs and advertising from a variety of parties to promote vaccinations. The dark green line is the key metric — the percent of Americans fully vaccinated. The light blue line is a leading indicator. It leads to total vaccinations by about 30 days, as it is measuring first doses.
The Briggs-3 model expected vaccinations to slow in June, July and August. Looking more closely, the leading indicator (light blue line) is showing more deceleration than expected in the model. In other words, the US will come up a little short of our vaccination goal unless we find ways to increase vaccination rates over the next few months.
While Europe should still see an effective end to the pandemic in Q3, as noted in the end of March Update,
“Europe is in the 3.1 worst case scenario now, due to slower than forecast vaccinations and the spread of more dangerous variants. It is still possible for Europe to catch up on vaccinations and see an effective end to the pandemic in Q3 (late Q3), but the incremental death toll due to slow vaccinations is projected well above a hundred thousand.”
Source: End of March Update, https://speakerrex.com/April1Update.html
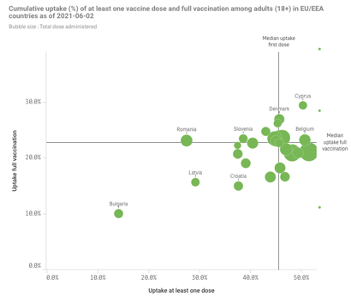
To take a closer look at Europe, the region should still achieve significant protection from vaccinations before the deadly fall and winter wave. However, the disparity in vaccination rates from one country to the next in Europe highlights a challenge in how to re-open the economy when community immunity is uneven.
Personally, I am working with my state to see if certain messages may be more persuasive and working with Ad Council in the US to provide my Vaccine Hesitancy scores to increase communications in counties that are furthest behind on vaccinations. If there is something you can do to make a difference, now is a great time to lean into the vaccination efforts. Roughly every 300 people you get vaccinated will save one person from dying of COVID-19.
In terms of forward view, the Briggs-3 model forecast the US will end June with about 603,500 deaths, which is less than 10,000 incremental deaths for the month. IHME and COVID Forecasting Hub (links) put the incremental deaths slightly higher, at about 11,000 and 12,000 incremental deaths, respectively.
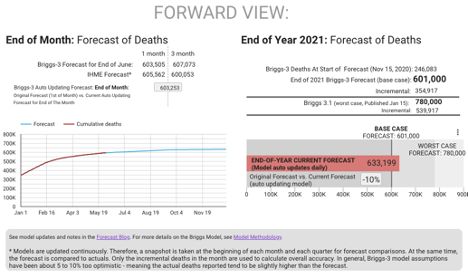
As COVID Forecasting Hub only forecasts 28 days out, the forecast for three months out compares the Briggs-3 Model to IHME. Briggs-3 forecast we will end August with an incremental 27,478 COVID-19 reported deaths (a total of 621,629) while IHME is forecasting 22,557 incremental deaths.
In comparison to the IHME forecast, the Briggs-3 Model was more accurate this last month in both the one month forecast and the three-month forecast. The Briggs-3 model has been more accurate in five of the last six months.
The Briggs-3 model continues to be slightly optimistic, underestimating COVID-19 deaths by an average of 5.9% with the three-month projection.
IHME only forecasts three months out, so the end of 2021 forecast for Briggs-3 has no comparison reference points. Seven months from now, the Briggs-3 Model forecast ending 2021 in the US with 633,199 reported COVID-19 deaths. This model assumes that no breakthrough variant will emerge and vaccination efficacy rates will remain around 90% or better and immunity will last for at least a year. The model is updated daily at www.speakerrex.com/dash.html.